


How Big is the Dollar Affordability Gap for Nevada Renters?
Most of Nevada’s very low-income renters are adequately housed. The housing problem most have is not inadequate housing or overcrowding, rather it is high rents that consume a very large portion of their income. This is a concern for households with very low incomes because the cost of the housing makes it hard to afford other necessities, including food and medical care, and may leave families one emergency away from not meeting the rent payment, which may lead to evictions.
In HUD terminology, very low income (VLI) households are households with a family income less than 50% of the HUD area median. HUD Comprehensive Housing Affordability Strategy (CHAS) data tracks four types of housing problems: lack of full kitchen, lack of full bathroom facilities, crowding and affordability, as measured by cost or rent burden. A rent burdened household pays more than 30% of its income for rent and utilities.
About 13% of Nevada’s VLI renters do not have a full kitchen, a full bath, suffer from overcrowding or a combination of the four problems. On the other hand, 78% of the VLI households experience only one housing problem: rent burden.[i]
In 2019 in Nevada, there were about 128,000 very low-income renter households experiencing rent burden. The average annual household income of these renters was about $16,000 a year.[ii]
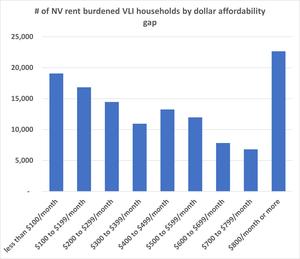
How much over 30% of income are these VLI rent burdened households paying for rent and utilities? Using the 2019 U.S. Census Bureau Public Use Microdata Sample we can estimate this gap. The dollar affordability gap was found to average about $460 a month. That is, for the average VLI renter household, a voucher or tax credit worth about $460 a month would relieve their rent burden. Fifteen percent of the VLI households had a gap of less than $100 a month. For another 14%, the gap was between $100 and $200 a month. On the opposite end of the spectrum, 40% of the VLI renters had a gap of $800 or more.[iii]
[i] U.S. Housing and Urban Development. 2013-2017 Comprehensive Housing Affordability Strategy with tabulations by the author. Consolidated Planning/CHAS Data | HUD USER
[ii] U.S. Census Bureau. American Community Survey 2019 1-yr Public Use Microdata Sample and analysis by author.
[iii] Ibid.


 Relay Service