


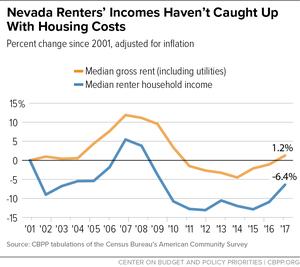
Nevada Renters' Incomes Decrease while Rents Increase
As measured in constant 2017 dollars, Nevada renters have suffered a decrease in median household income of 6.4% from $45,000 in 2001 to $42,100 in 2017. Over the same period median gross rents (including utility costs) increased 1.2%. (1) A gap between changes in rents and changes in renter household income formed in the 2001 recession, decreased somewhat during the bubble leading up to the Great Recession, widening even further in the recession and the years following. In the last two years median renter income increased faster than median rents but has not caught up.
Since rents have increased and renter household income has decreased, renters have a smaller amount of money leftover to purchase food, childcare, healthcare, transportation and education. Statistics on rent burden, households paying more than 30% of household income for rent and utilities, show burden increasing from 36.1% of all renter households in 1999 to 47.9% in 2017. (2)
The reader may wonder why Census statistics indicate such a small increase in rent when many rent series seem to indicate far greater increases in recent years. Here are some reasons for the difference:
- Most rent series from real estate firms do not adjust for inflation as is done above.
- The change reported above is over a long period of time from 2001 to 2017 so takes into account large fluctuations that have occured over the long term. A shorter time series may show a greater change.
- Census Bureau rent is from a survey that attempts to include all types of rental housing. It is far more inclusive than most rent series.
- Census Bureau rent includes rent for existing units of renters in place as compared to some rent series which include only asking rents of units on turnover to a new tenant.
- Median rents reported above may tend to be lower than average rents reported in some series.
- The statistics above are for gross rents which include utilities. The cost of some utilities such as gas and electric may have decreased over the time period.
(1) Census Bureau's American Community Survey data adjusted for inflation with CPI-U as tabulated by Center on Budget and Policy Priorities. Nevada graph and numbers from personal communication with A. Muzarra, 10-28-2018.
(2) Census 2000, DP-4, Profile of Selected Housing Characteristics and American Community Survey 2017 1-year Estimates, DP04, Selected Housing Characteristics.


 Relay Service