Who Lives Where in Nevada Rental Housing
The U.S. Census Bureau’s American Community Survey asks respondents to report housing costs such as rent and utilities. Using this data an estimated 36% of Nevada’s rental housing stock in 2017 had gross rents (rent plus utilities) of between $875 per month to $1,250 per month. Twenty-six percent of Nevada’s rental housing stock had gross rents ranging from $1,250 a month to $1,875 a month while 20% had gross rents ranging from $625 to $875. Gross rents ranged from $1,875 to $2,500 for five percent of housing stock and 2% had gross rents over $2,500. Only nine percent of the stock (44,000 units) had gross rents below $625 while 2% of the units (12,000 units) were occupied with households that did not pay any rent.[i]
Using the 30% standard, these final two categories, which consisted of about 56,000 units, made up the housing that might be affordable to households with incomes under $25,000 a year. The 30% standard posits that households can afford to pay up to 30% of their income for rent and utilities without impacting the household’s budget for non-housing items. If a household pays more than 30% of household income for rent they are considered rent burdened. Using the 30% standard to determine affordability, a household making $25,000 a year could afford to pay up to $625 a month in gross rent without incurring rent burden.
The U.S. Census Bureau’s American Community Survey also asks respondents to report household income. Using this data, an estimated 28% of Nevada renters had an income under $25,000 a year in 2017. Twenty-eight percent corresponds to about 132,000 renter households with incomes less than $25,000 a year. Thus there was an absolute shortage of about 76,000 units affordable to these lower income households.
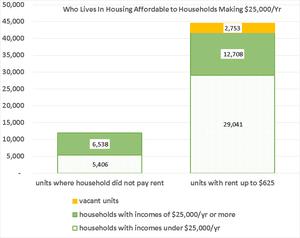
However, the shortage is made more acute because many of the 56,000 units with gross rents under $625 a month were occupied by households that make more than $25,000 a year and thus were not available to the lowest income renters. This is illustrated in the Figure. For units where respondents reported paying no rent, about 5,400 households in these units had a household income under $25,000. The remaining 6,500 households paying no rent had incomes of $25,000 a year or more and could have afforded to pay at least some rent, according to the 30% standard.
Similarly, 70% of households paying gross rent up to $625 a month were in the lowest income category with income of less than $25,000. Thirty percent of households, approximately 12,700 households, in these low cost units could have afforded to pay more according to the 30% standard. Subtracting out such unavailable units, there were actually only about 37,000 units affordable and available to the 132,000 renter households making less than $25,000 a year. Since these housing options aren’t available to lower income households, the shortage of units with gross rents lower than $625 a month is actually closer to 95,000 units.
This analysis could be further refined by better accounting for household size. Households of one, for example, might be able to afford to pay more than 30% of household income for rent and have enough to cover necessities while low income households with children might have so many non-housing expenses they couldn’t afford to pay 30% without giving up other basic necessities.
A similar analysis shows that for all categories of households making under $50,000 a year, there is a shortage of available and affordable housing units, in part because the available low cost units are occupied by higher income households.
Perhaps surprisingly, the data shows that for housing units which have a gross rent of $1,875 or more, 22% of households occupying these units had incomes under $50,000 a year. The 30% standard indicates that a gross rent of $1,250 a month or less would be appropriate for this income group.
The source of the data is U.S. Census Bureau, 1-year 2017 American Community Survey Public Use Microdata sample for households in Nevada with tabulations and additional analysis by the author.
[i] Utilities for vacant for rent units were imputed by the author.