Update on Nevada Homeless Trends
The rate of Point-in-Time (PIT) homelessness decreased in Las Vegas for the 4th year in a row. In 2018, Reno's rate of PIT homelessness surpassed Las Vegas' and remains higher in 2020 despite a decrease from 2019 to 2020. Both rates are well above the national average.
Using a rate of PIT homeless count per thousand population helps to account for population increase or decrease and facilitates comparisons across regions. To investigate how point-in-time homelessness varies over time and to compare changes between regions with different sized populations, a rate of Point-in-Time (PIT) homeless per thousand population was calculated using the PIT count results and Vintage 2020 Census Bureau population estimates. Annual PIT data is available from 2007 onward. [i]
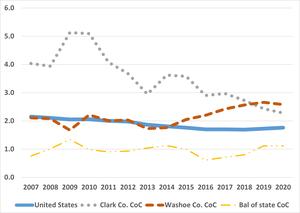
The U.S. Department of Housing and Urban Development (HUD) requires each Continuum of Care (CoC) in the country to carry out the PIT count of both the sheltered and unsheltered homeless sometime in the last week of January. The figure shows a time trend for total homeless PIT counts per 1,000 population by each of the Nevada CoCs, Las Vegas/Clark County CoC, Reno/Sparks/Washoe County CoC (Washoe County CoC) and Nevada Balance of State CoC (Rural Nevada CoC) and for the U.S. from 2007 to 2020.
The Las Vegas region had the highest rate of homeless PIT count throughout the 2007 to 2018 period. But starting in 2019, rates in Reno surpassed those of Las Vegas. In 2020, the Las Vegas/Clark County Continuum of Care recorded 5,283 homeless, down from 5,530 in 2019. The rate per thousand population decreased from 2.4 to 2.3. In Reno, 1,231 homeless were counted in 2020 down from 1,256 in 2019. The rate per thousand population for Reno was 2.7 in 2019 dropping to 2.6 in 2020.
The rural CoC has always reported the lowest rate, varying from 0.8 to 1.3 per thousand. However, the rural CoC is typically not able to carry out the count in each of the counties, and it may be even more difficult to obtain a full count than in urban areas.
The U.S. rate of PIT homeless per thousand has had a decreasing or steady trend since 2007, but increased from 1.7 per thousand population in 2019 to 1.8 in 2020.
For similar comparisons for southwestern states and for veteran homelessness rates contact Elizabeth Fadali at efadali@housing.nv.gov and request the PIT Homeless Count Trend Graphs.
[i] The PIT count is a snapshot of homelessness on one particular day and is not the same as the estimate of total population that has experienced a bout of homelessness over the entire year. By its nature it is not easy to accurately count people without an established home so the PIT count must be understood in that context. Counts may be influenced by many factors including the weather, number of volunteers available and more. For more information see U.S. Housing and Urban Development. 2014. Point-in-Time Count Methodology Guide at PIT-Count-Methodology-Guide.pdf. For more PIT data see the Point-in-Time Count.