What “rent burden” means for renter households at different income levels: a Las Vegas example.
A standard definition for affordable housing costs is a gross rent (rent plus utilities) that is less than 30% of household income. The ratio of gross rent to income is easily calculated with American Community Survey data and is readily available for many levels of geography through a special tabulation the Census Bureau produces for the U.S. Department of Urban Development called the “CHAS” data. A ratio of housing costs to household income is also readily calculated for individual households and is used widely by both government and private industry to determine affordability. What's more, it's relatively easy to compare for different regions and time periods.[i]
One of the problems with the rent burden standard emerges when looking at opposite ends of the income spectrum. Suppose a household with a $1,000,000 annual income rents a Penthouse apartment in Park Towers in Las Vegas for $42,000 a month. This would cost the household over 50% of its income, technically putting it into the severe rent burden category. Yet the household would have close to a half a million dollars leftover to meet its non-housing budget for the year.
On the other hand, take a single person household with Supplemental Social Security as its entire income. This household has an income of less than $10,000 a year. Suppose this individual is able to find an apartment for rent for $236 a month including utilities, which is 30% of its monthly income. Technically this household is not experiencing rent burden. About $550 a month is leftover to meet its non-housing budget each month. It seems likely that this household may struggle to meet basic non-housing needs even though it technically has no "rent burden."
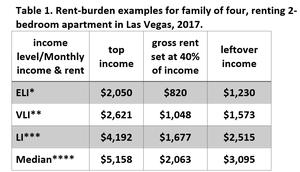
In the accompanying chart this issue is explored for income levels between the two extremes of the millionaire family and individual on SSI. The example uses a family of four living in Las Vegas in 2017. At each income level the family is assumed to have the maximum income in that HUD income category. For example, the extremely low income (ELI) family had the maximum annual income for that category of $24,600. In this hypothetical example, the family is able to secure a two bedroom apartment in Las Vegas for $820 a month including utilities which is 40% of their monthly income, putting the family into a category of rent burdened.
Suppose another family of four received a median income (100% of AMI) of $61,900 and also had rent burden, paying 40% of its income in gross rent which for this family occurred at $2,063 per month. This family has over $3000 a month leftover to purchase non-housing goods and services despite the rent burden they are experiencing.
Although at a similar level of rent burden these two households faced very different options both in terms of how many apartments or homes were affordable at their income level and how much income is leftover for other expenses. At $800 a month the extremely low income family would have found about 20% of the rental stock in Clark County in 2017 affordable with many of these units being studio or one-bedroom apartments inappropriate for a family of four, while the rent-burdened median income family paying about $2000 a month for gross rent would have been able to afford about 96% of rental options, according to American Community Survey data (Table B25063, Gross Rent, ACS 1-year estimates).
The HUD income levels given in the table do not account for non-cash benefits or net taxes. Net benefits and taxes would tend to bring down income levels for the higher income families in the table above while raising income levels for lower income families. Using rough estimates for Social Security and Medicare taxes, federal taxes, food stamp and returned income tax credits, in net this could increase the ELI family residual income considerably such that the monthly income after rent is $1600 a month and could reduce the residual left for the median family income to around $2,100 a month.[ii] In addition, in 2017 a family of four with annual income under $33,948 (encompassing the VLI and ELI categories) would have qualified for Medicaid. Research has shown low income families without Medicaid spend significantly more on healthcare costs.[iii] For example, one study found that low income families with Medicaid spent an average of $235 per year on medical expenses versus $1,739 for low income households without Medicaid.
Chart Sources: Income level cut-offs in the second column are HUD income limits for a family of four in Las Vegas-Henderson-Paradise in 2017 divided by 12. Income is assumed to be the maximum possible for that category of household. Rents in the third column are 40% of income by assumption in order to produce an example of rent-burdened households at each income level. Residual in the fourth column is total monthly income minus gross monthly rent.
[i] Herbert et al. 2018. Measuring Housing Affordability: Assessing the 30% of Income Standard. Harvard Joint Center for Housing Studies. See also Stone, Michael. 2006. “What is Housing Affordability? The Case for the Residual Income Approach.” Housing Policy Debate, Vol. 17, Issue 1.
[ii] Larimore, Jeff and Jenny Schuetz. 2017. “Assessing the Severity of Rent Burden on Low Income Families”, Fed Notes, https://www.federalreserve.gov/econres/notes/feds-notes/assessing-the-severity-of-rent-burden-on-low-income-families-20171222.htm accessed 6-6-2018. The article finds that households with two children at the median of the lowest quintile could have up to $9,000 in benefits from food stamps and earned income tax credits. On the other hand, a family with income of $24,600 would pay nearly $4000 for FICA payroll taxes. A family with two children earning median income in 2017 in Las Vegas would pay about $2000 in federal income taxes and an additional $9,000 in FICA taxes. https://www.fool.com/taxes/2018/01/27/if-i-make-60000-how-big-will-my-tax-cut-be-in-2018.aspx , https://www.taxformcalculator.com/calculator/FICA-calculator.html
[iii]Majoral et al. 2016.Healthcare Spending among Low Income Households with and without Medicaid. https://www.kff.org/medicaid/issue-brief/health-care-spending-among-low-income-households-with-and-without-medicaid/