Nevada Homeless Trends
Is homelessness increasing or decreasing in Las Vegas? What about Reno? Which area has more homelessness? And how does Nevada compare nationally? To investigate these questions a rate of Point-in-Time (PIT) homeless per thousand population was calculated using the PIT count results and Vintage 2018 Census Bureau population estimates. Annual PIT data is available from 2007 onward. [i]
The U.S. Department of Housing and Urban Development (HUD) requires each Continuum of Care (CoC) in the country to carry out the PIT count of both the sheltered and unsheltered homeless sometime in the last week of January. Using a rate of PIT homeless count per thousand population helps to account for population increase or decrease and helps facilitate comparisons across regions.
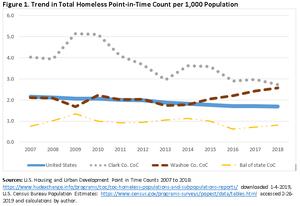
The figure shows a time trend for total homeless PIT counts per 1,000 population by each of the Nevada CoCs, Las Vegas/Clark County CoC, Reno/Sparks/Washoe County CoC (Washoe County CoC) and Nevada Balance of State CoC (Rural Nevada CoC) and for the U.S. from 2007 to 2018.
The Las Vegas region has had the highest rate of homeless PIT count throughout the 2007 to 2018 period. However, they've also recorded the largest drop in the rate from 4.0 to 2.7 per thousand, a drop of 32%. The rural CoC has always reported the lowest rate, varying from 0.8 to 1.3 per thousand. However, the rural CoC is typically not able to carry out the count in each of the counties, and it may be even more difficult to obtain a full count than in urban areas. The Reno trend may be the most dramatic, having trended mostly downward from 2.1 to 1.8 per thousand, approximately with the national rate, until 2015 when the Reno rate started increasing while the national homeless PIT per thousand rate has continued to decrease. By 2018 the Reno area CoC reported 2.6 per thousand, a rate just under the Las Vegas rate of 2.7 per thousand. In a 2001 paper, Quigley and Raphael link homelessness to economic conditions including housing prices, vacancy levels and rent-to-income ratios.[ii] The expansion of an industrial park in Storey County in conjunction with the recovery seems to have had a large impact on the Reno employment and housing market. According to the local Johnson, Perkins and Griffin apartment survey, it was in 2015 that average rents increased by 9% over the previous year with double digit rent increases in 2016 and 2017. For nearly a decade previous to this rents increased modestly or even decreased. In addition, a city campaign to reduce blight began in 2015 to demolish motels that have traditionally been housing of last resort for lower income households. The city campaign added on to an already considerable level of motel demolition in the private sector. Either or both of these changes may have influenced the rate of homeless point-in-time count in Reno.
For similar comparisons for southwestern states and for veteran homelessness rates contact Elizabeth Fadali at efadali@housing.nv.gov and request the PIT Homeless Count Trend Graphs.
[i] The PIT count is a snapshot of homelessness on one particular day and is not the same as the estimate of total population that has experienced a bout of homelessness over the entire year. By its nature it is not easy to accurately count people without an established home so the PIT count must be understood in that context. Counts may be influenced by many factors including the weather, number of volunteers available and more. For more information see U.S. Housing and Urban Development. 2014. Point-in-Time Count Methodology Guide at PIT-Count-Methodology-Guide.pdf. For more PIT data see the Point-in-Time Count.
[ii] Quigley, J. M. and S. Raphael (2001). "THE ECONOMICS OF HOMELESSNESS: THE EVIDENCE FROM NORTH AMERICA." European Journal of Housing Policy 1(3): 323-336.