2022 Affordable Housing Dashboard
Washoe and Clark Counties worse than national average on seven of ten indicators.
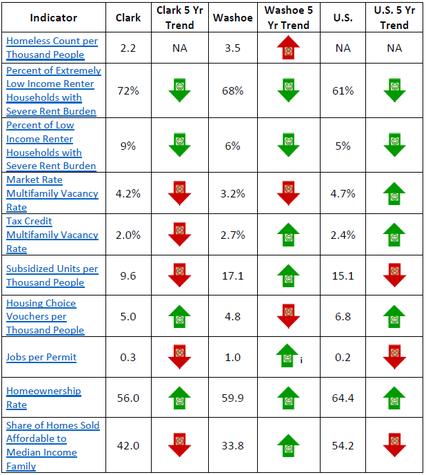
Clearly 2022 was a tough year for housing affordability as rents and home prices increased by record levels across the nation, far outpacing increases in wages. Amid this tough year, Nevadans in both Washoe and Clark Counties are worse off as compared to the U.S. average on seven of ten of the dashboard indicators. Clark County came out worse than the nation on nine indicators. Some good news was that Washoe County came out with a vacancy rate higher than the national average for tax credit properties as well as a higher rate of subsidized units per thousand people.
Washoe and Clark Counties do not have the same affordable housing profile.
In some respects, the housing affordability picture seems better in Washoe County. Bright spots in Washoe County as compared to Clark County include a higher rate of homeownership, a higher number of subsidized units per thousand population and a smaller proportion of extremely low income households experiencing rent burden with the latter two indicators possibly related. But Washoe County had a much higher rate of homelessness than Clark County, with both rates higher than the national average (using the previous year's indicator for the U.S.). And home affordability for buyers is extremely low in Washoe County with only about 34% of recently sold homes affordable to a family with a median income. Again, affordability is worse in both counties as compared to the national average.
What about the five-year trend: are we making progress?
Many of the green arrows (positive trends) on the dashboard are on indicators with the longest data lags. For example, the proportion of extremely low income and low income rent burdened households was trending down or staying the same for all three regions, which is good news. But the data are for 2015 to 2019, good years as the economy picked up steam after the Great Recession, as compared to the period of 2010 to 2014 which includes some of the Great Recession years. These numbers do not yet reflect the housing dislocations that came about during the Covid and post-Covid era. Another bright spot on the dashboard was the increasing percentage of households owning a home for all three regions. However, this reflects the upward trend in homeownership from 2016, when homeownership was just beginning to recover from the Great Recession, to 2020, before the big effects of Covid-19 unemployment, housing assistance and finally record price increases, would be reflected in the data.
The trend towards lower vacancy rates in multifamily apartments in both counties summarizes the landlord’s marketplace that has developed gradually since the Great Recession, with rents rising faster than incomes. Other trends were mixed. Some of the data on homelessness was not available, or was collected using a different methodology, because of Covid-19 issues, but the long-term trend in Clark County had been positive with PIT homelessness per 1000 decreasing from 2015 to 2020, even though nationwide PIT homelessness per 1000 saw an uptick. Washoe County on the other hand, has had an increasingly worse problem with homelessness developing over the past five years. Washoe County, however, was making some progress in availability of solutions, trending up in the number of subsidized units per thousand measure and down in the vacancy rate for tax credit properties, with the opposite happening in Clark County.
The Affordable Housing Dashboard Report further documents the methodology and expands the context for each of the dashboard indicators, in many cases providing a chart and/or table with the entire time series, additional information on Nevada counties outside of Washoe and Clark, component numbers used to calculate rates and more.